Web Activity Report
Web Activity Reports Homepage
From the web activity reports homepage, you will find a visual summary and list view for all pages within a selected time frame. The default time frame is the current month to date.
To choose a time frame, click the calendar drop down menu and select a set time frame or a custom range and click Apply.
Dashboard Visual Summary and Graph
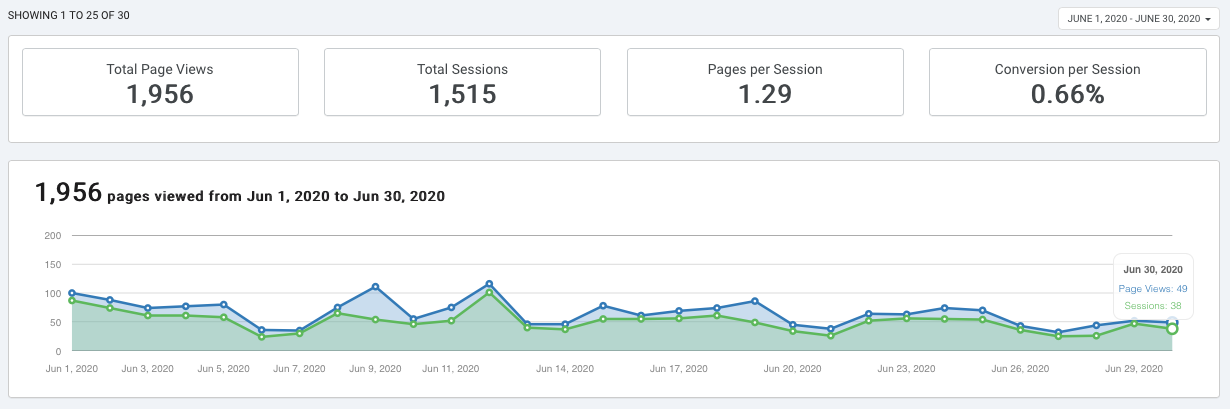
The following metrics are reported and visually represented in the dashboard:
- Total Page Views: pages viewed for any DailyStory pages and website pages where the DailyStory beacon is installed
- Total Sessions: number of visits to website within a rolling 20 minute window
- Pages Per Session: number of pages visited within a rolling 20 minute window
- Conversion per Session: how many new leads were generated during each session
A conversion is when a leads fills out a form or clicks a submit button on acquistion tools like forms and pop-ups.
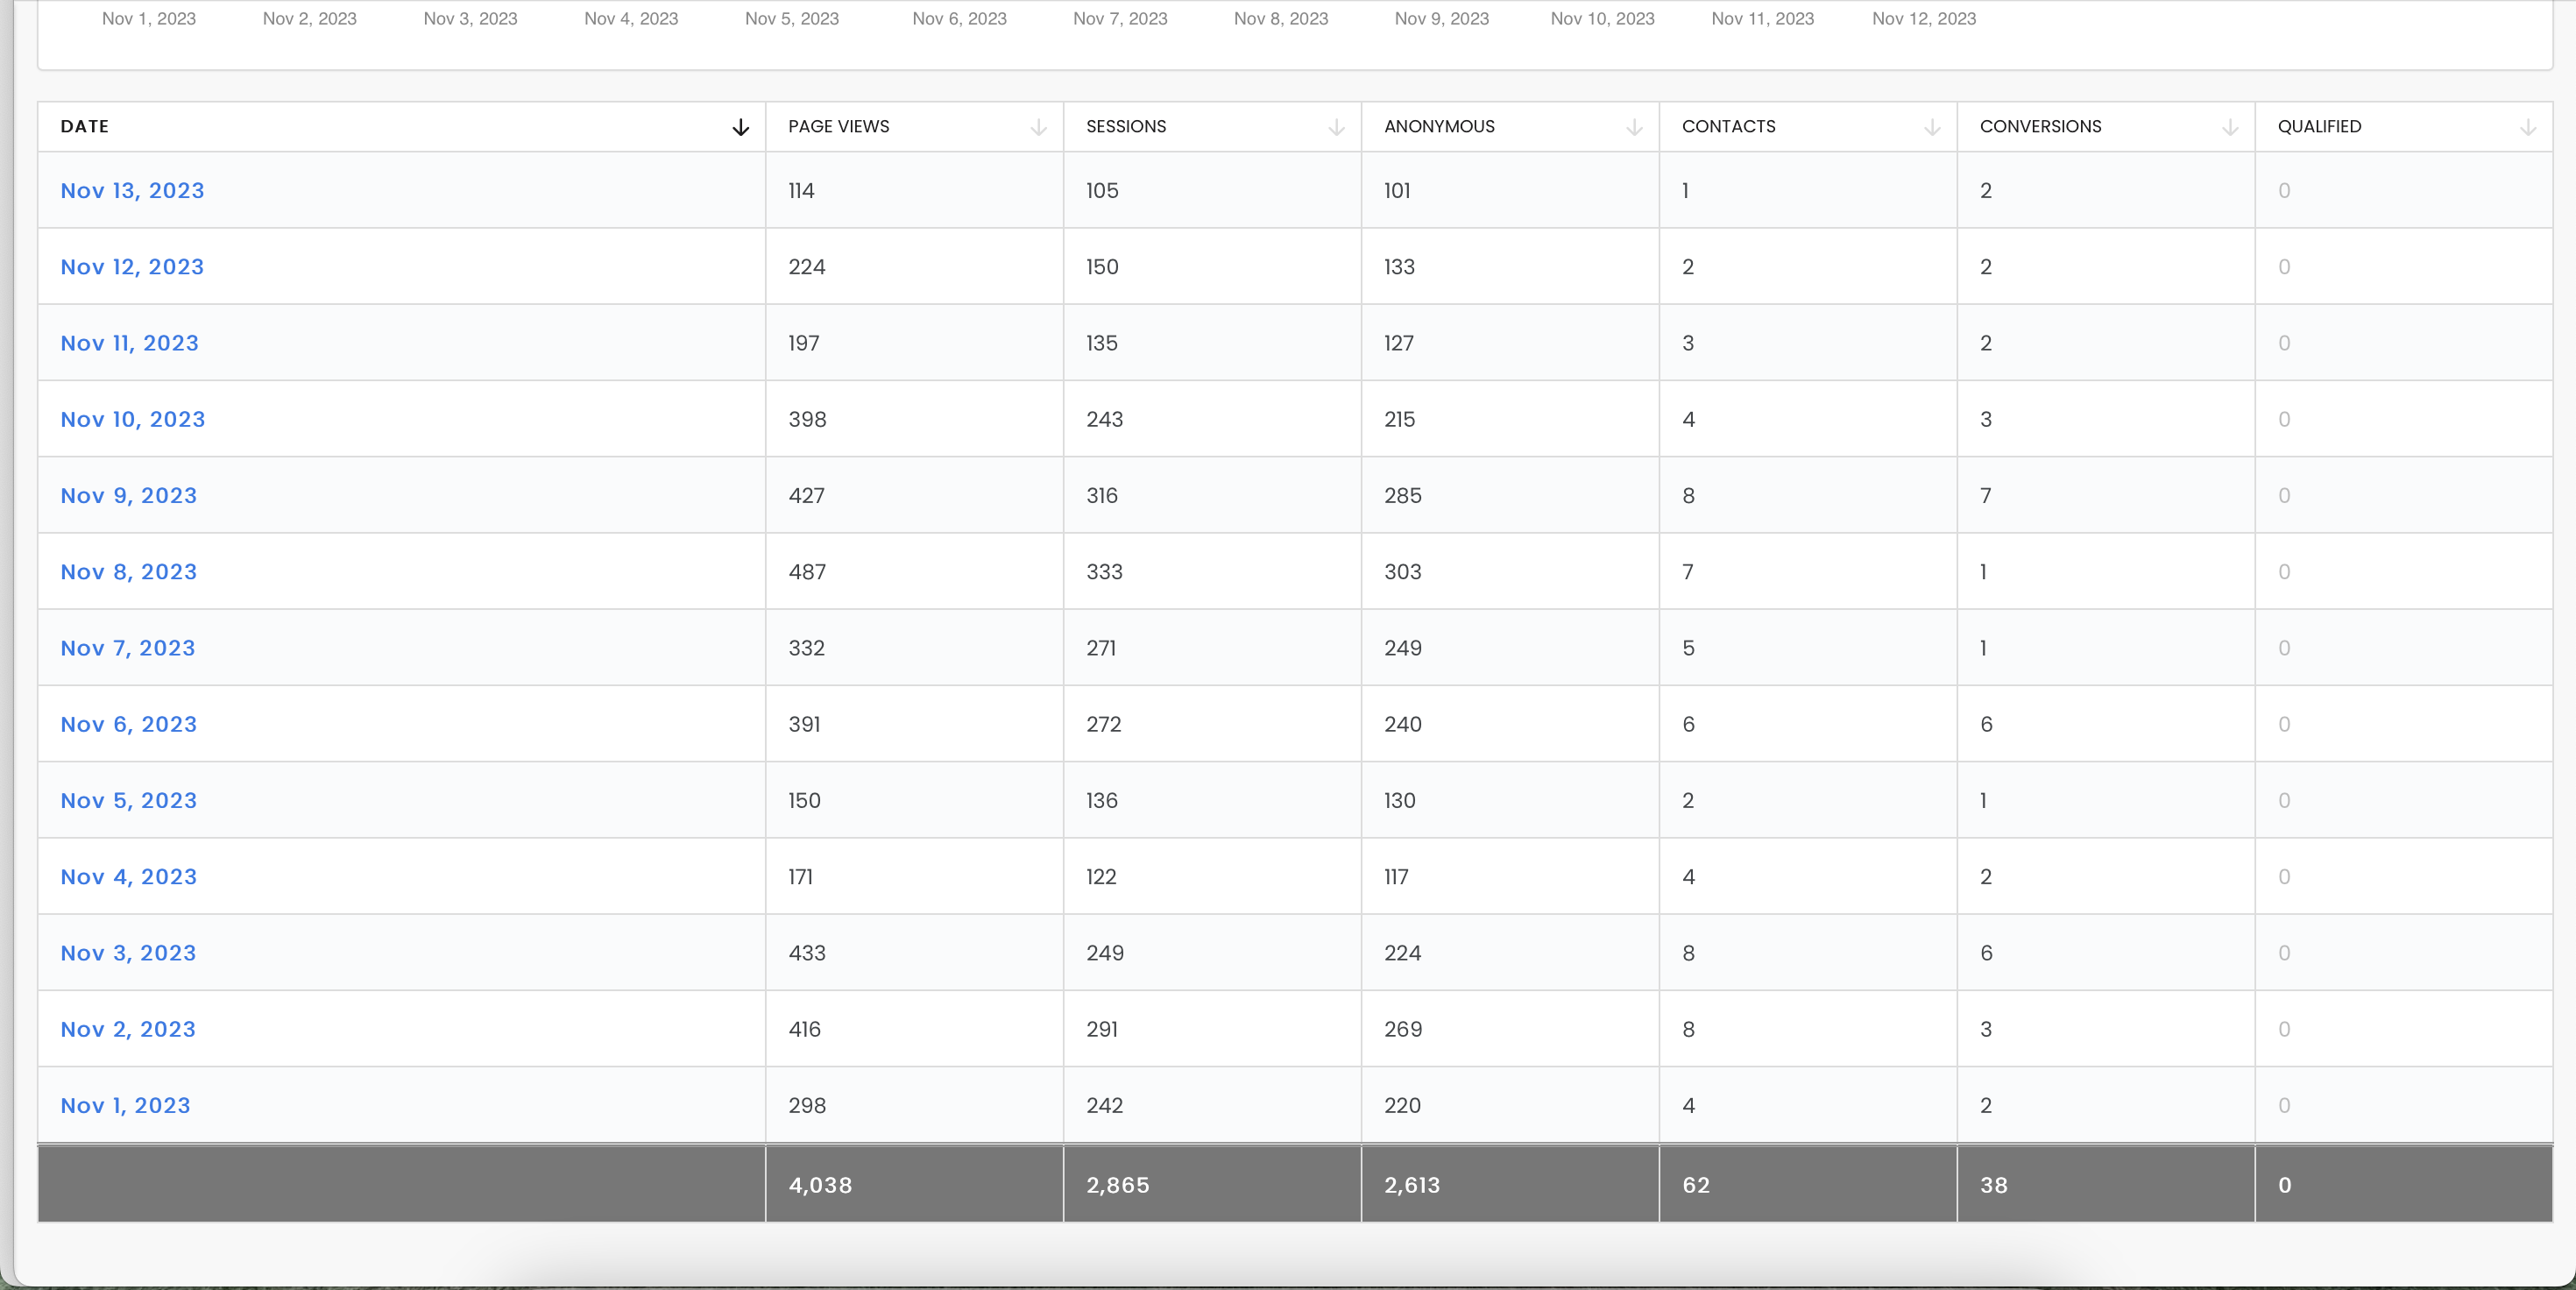
Beneath the dashboard, you will see the list of dates for the time frame selected in the previous step and the following report information for each:
- Date
- Pages views
- Sessions
- Anonymous (contacts not currently in DailyStory)
- Contacts (contacts currently in DailyStory)
- Conversions (filled out a form)
- Qualified
 Recommended
To see more detail, click on any of the blue date fields and you will be taken to the breakdown of page view information.
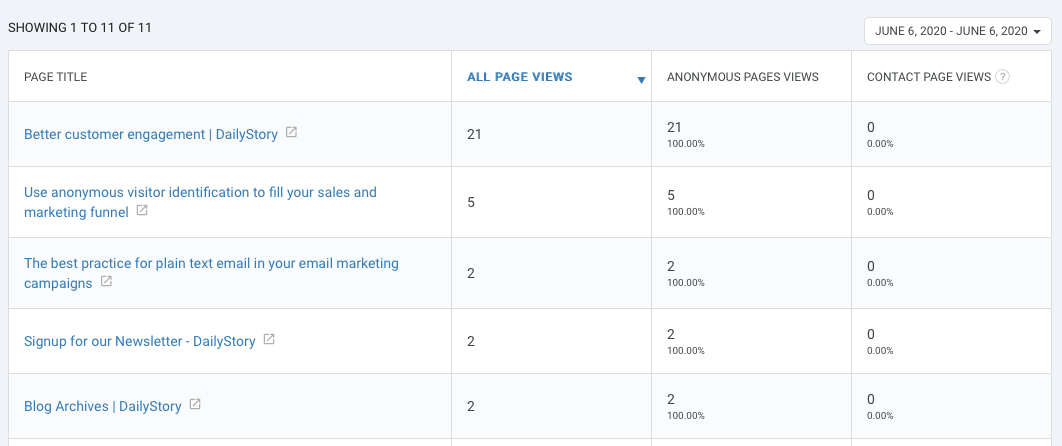
Individual Page View Report
Once you are in the report page for that date, you will see a breakdown of the pages viewed on that day, how many views each page received, how many visitors were anonymous, and how many visitors were current contacts.
 Recommended
To see more detail for the specific page, click on any of the blue page titles from the list.