Popups Report
Popups Reports Homepage
From the Popups reports homepage, you will find a metrics dashboard, graph and list view for all popups within a selected time frame. The default time frame is the current month to date.
To choose a time frame, click the calendar drop down menu and select a set time frame or a custom range and click Apply.
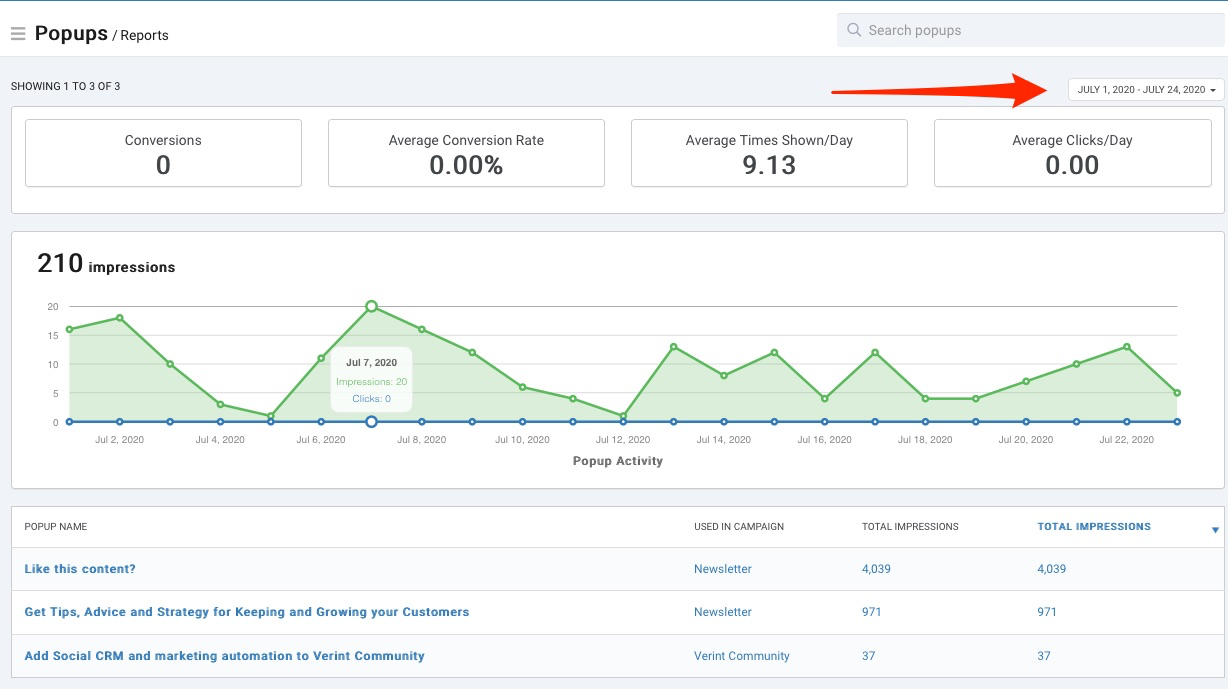
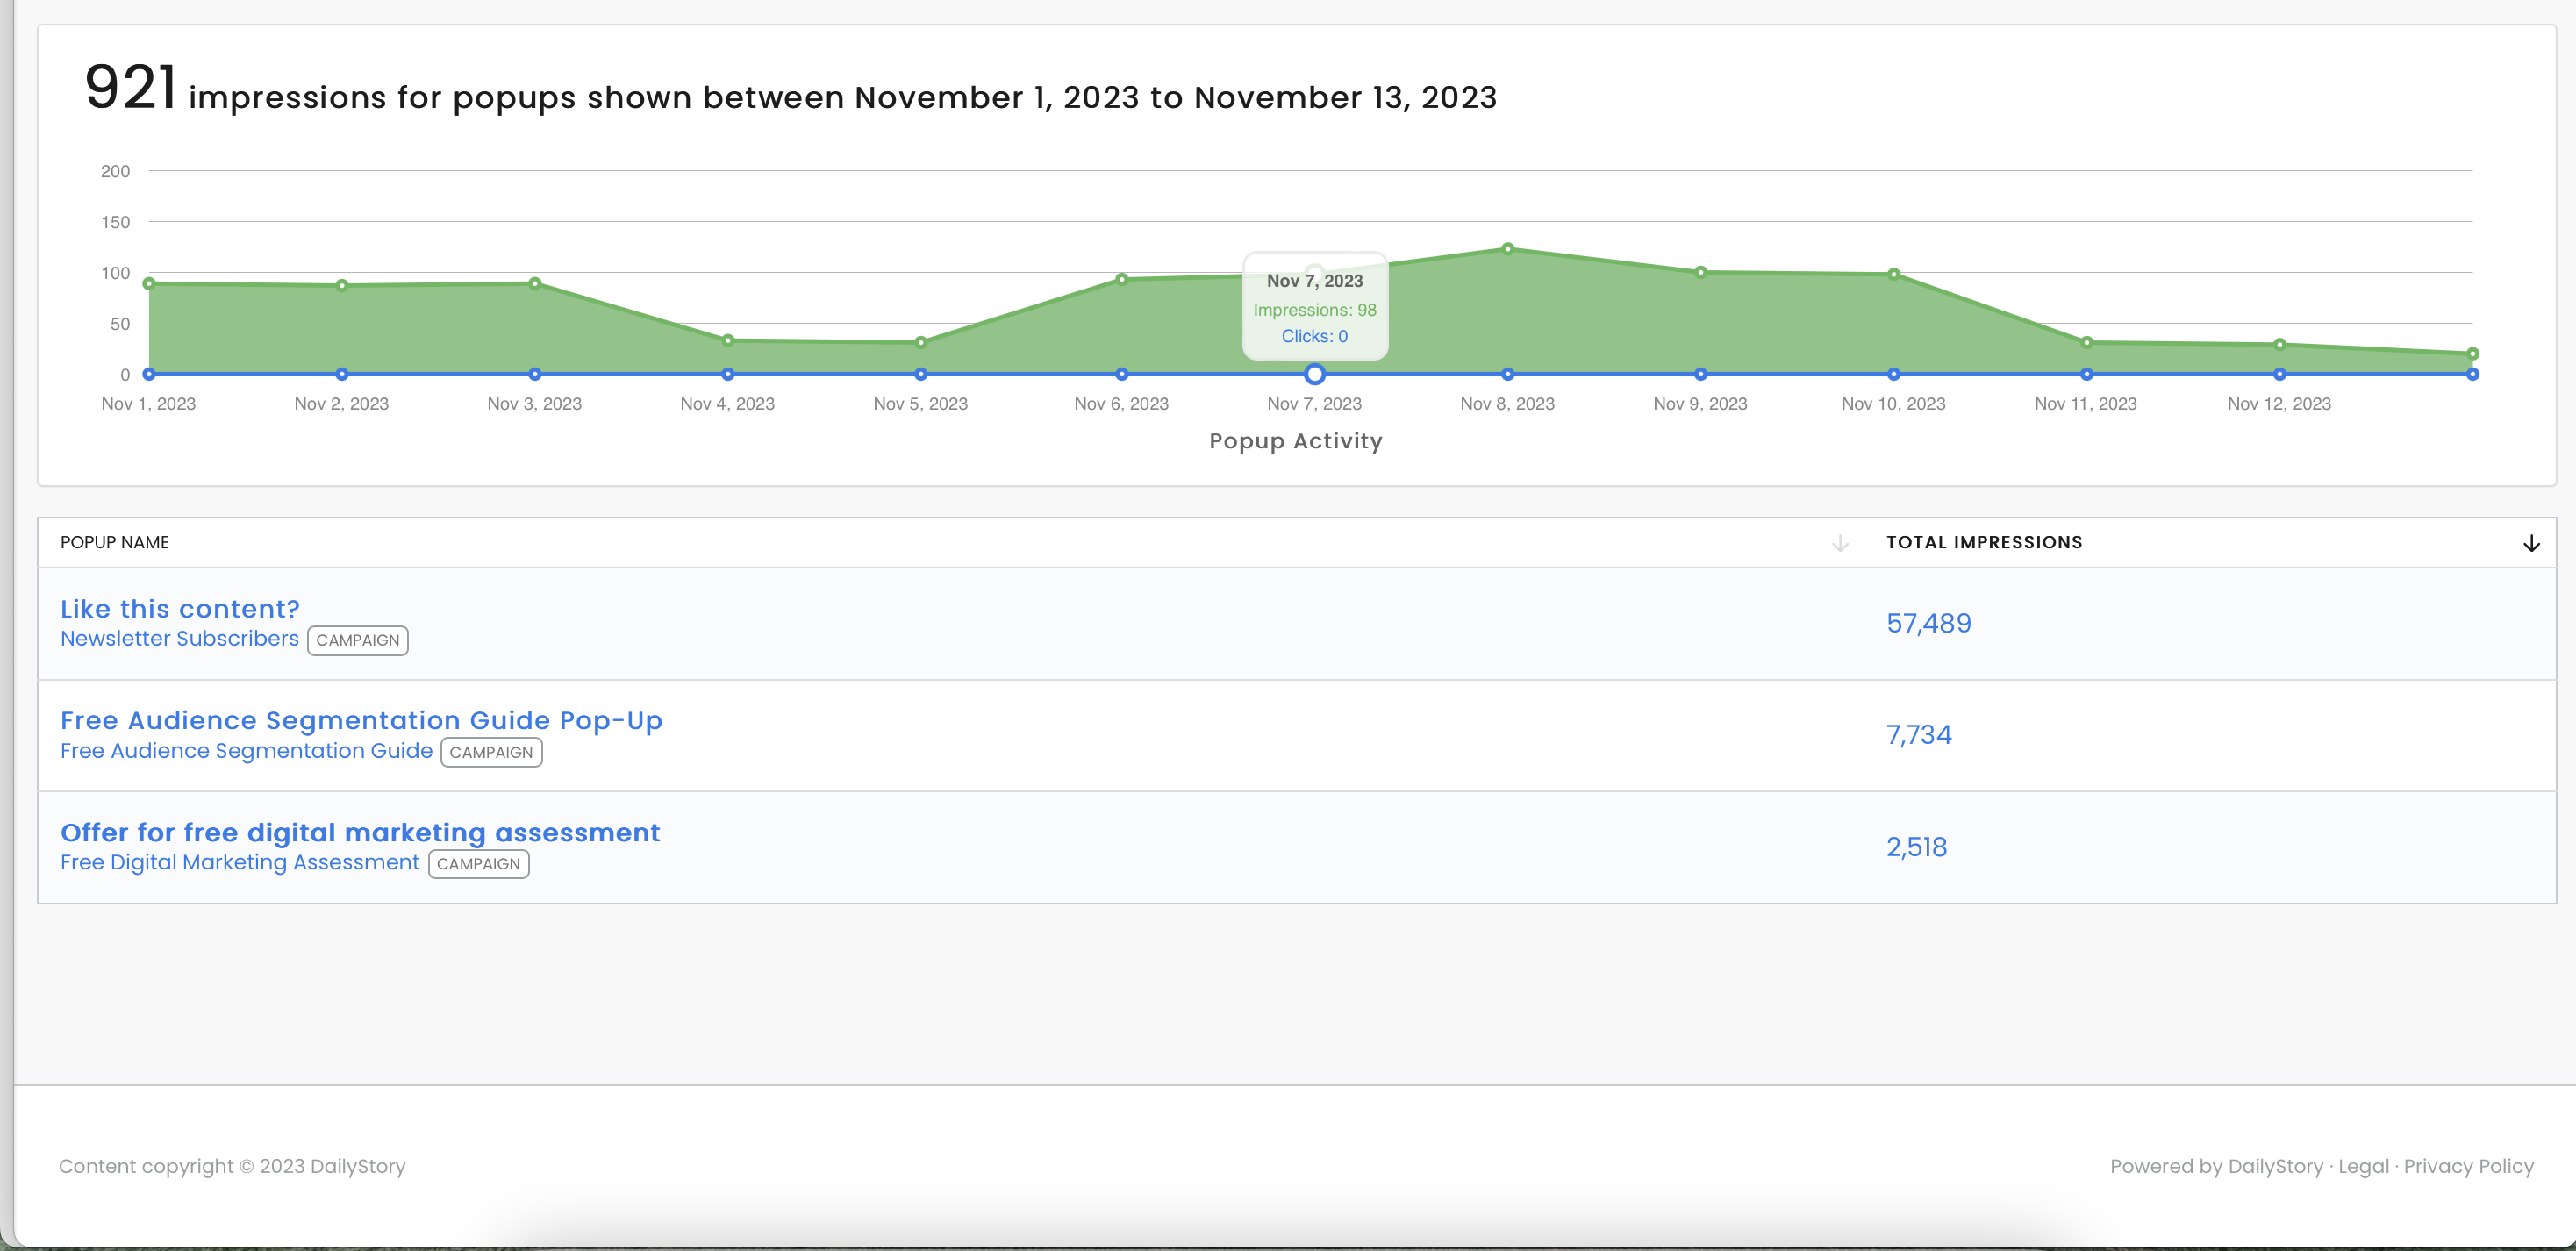
Beneath the graph, you will see the list of Popups for the time frame selected in the previous step and summary information for each:
- Popup Name
- Total Impressions: number of total times shown
 Recommended
To see more detail, click on any of the blue fields and you will be taken to the relevant data for that individual popup metric.
Individual Popup Report
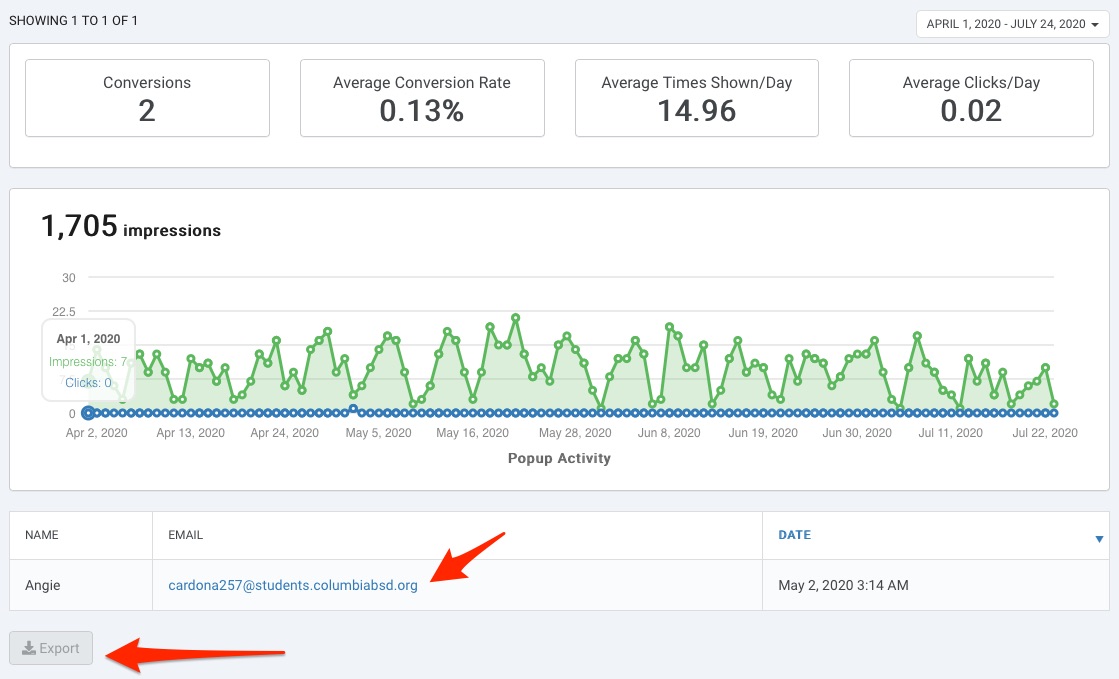
Once you are in the report page for the popup, you will see a dashboard of metrics, a chart representation and the list of contacts that converted for the time period selected.
To see details for the specific lead record that converted on the popup, click on the email link. More on lead records.
You also have the ability to export this list by click on the Export button at the bottom of the page. More on exporting.