Reports and Dashboards Guide
Reports and Dashboards enable you to see insights about your contacts as well as track, measure and monitor how your contacts and prospective clients interact with your marketing.
Here's what you'll find in the Reports section
RecommendedUnless noted or you have the option to set a time period, charts reflect a rolling 60 days.
Dashboards
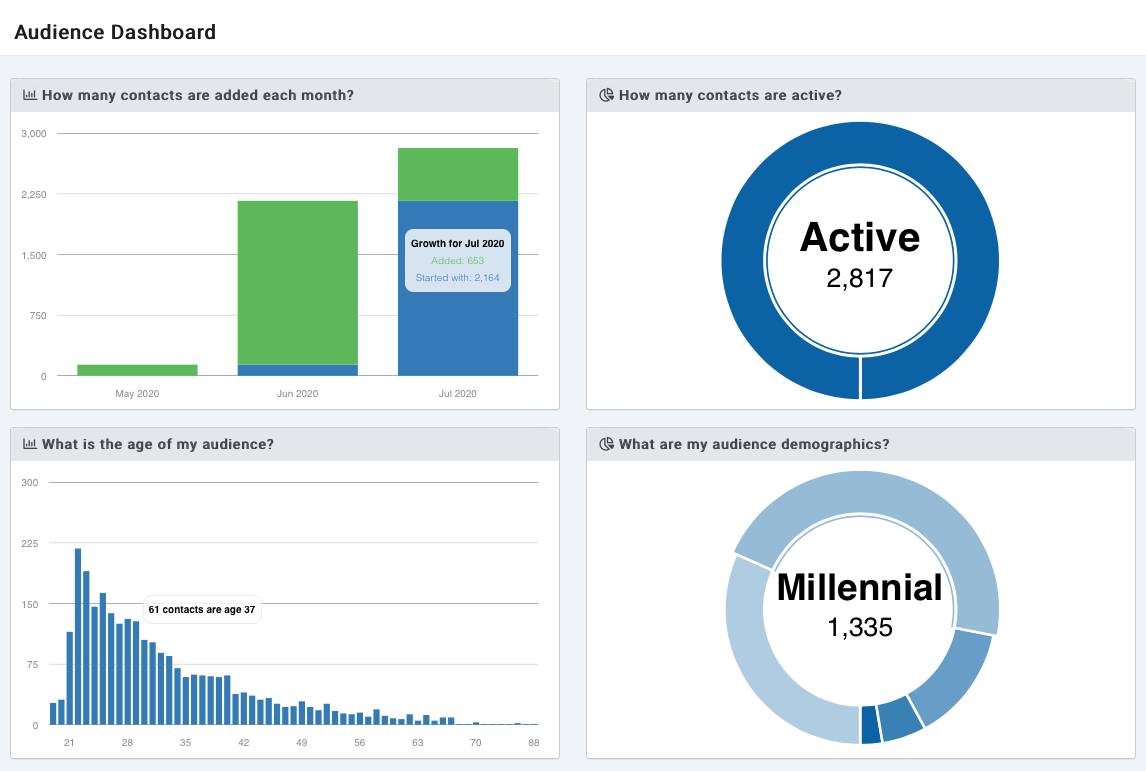
Dashboards are an information management tool that visually displays key performance metrics, data points and metrics. The following dashboards are available in DailyStory:
- Audience Dashboard—generates a report on the demographics of your contacts and monthly contacts acquisition.
- Email Dashboard—generates a report on your overall email insights, specifically on when your emails get most and least engagement.
- Push Notification Dashboard—generates a report on how many contacts are added via push notifications each month and how many push notification-enabled contacts are still active.
- Conversion Funnel—generates a report on your lead conversions from all acquisition methods.
- Inbound Leads—generates a report of all new leads from the beginning of the month up to the current day.
Customizing Your Marketing KPIs
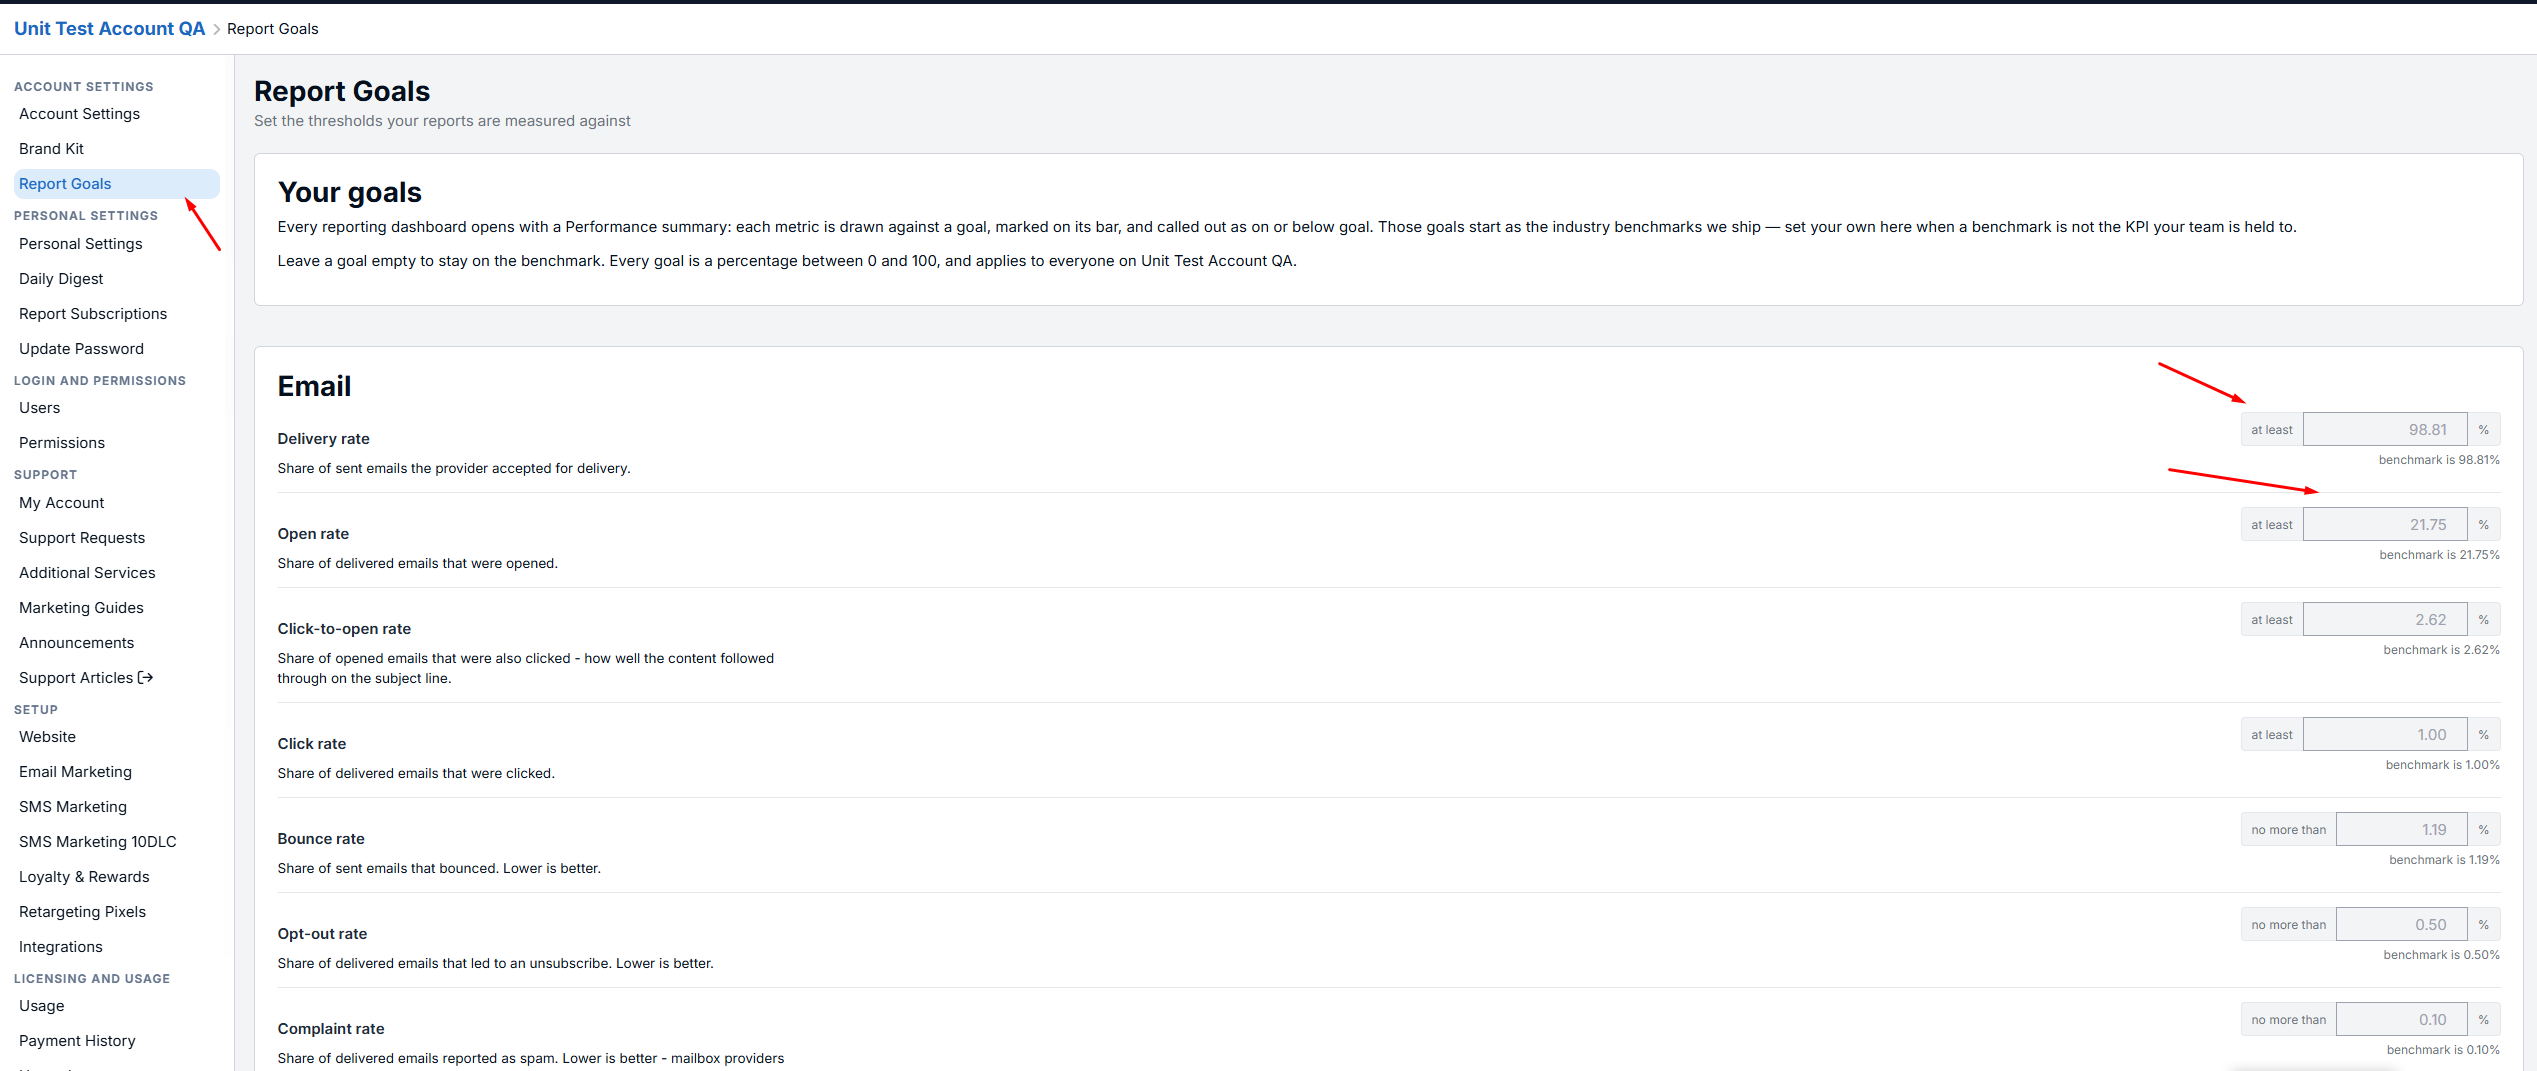
DailyStory allows you to set custom goals and targets for your key performance indicators (KPIs), so your dashboards reflect the benchmarks that matter most to your business.
RecommendedIf you choose not to set up custom KPI's, our system will default to industry standards.
To customize your KPI goals, navigate to Account Settings > Report Goals. From there, you can set a target value for each dashboard metric you want to track.
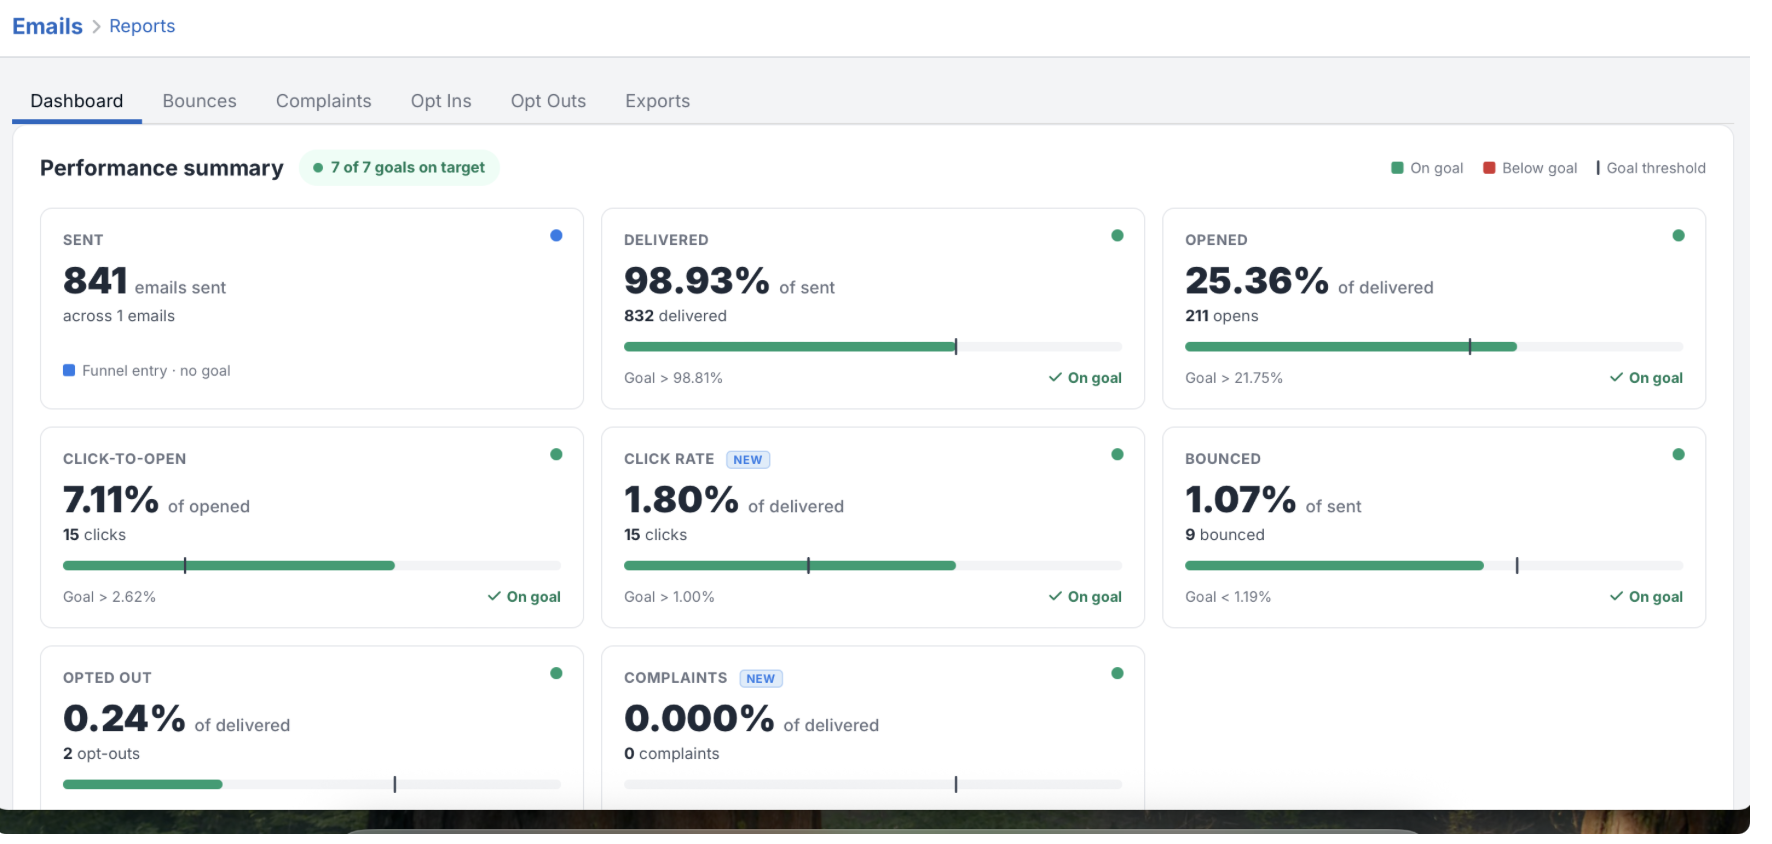
Once a goal is set, your dashboards will display a red/green indicator next to the metric showing whether you are on track (green) or falling short (red) of your target.
Reports
The Reports page for an asset feature allows you to select a timeframe and see an overall pictures of customer behavior across those assets. You can also select invidiual reports to drill down further into delivery rates, opens, clicks and much more! The following reports are available in DailyStory:
- Sent Emails—generates a time period-specific report on the number of emails you've sent as well as the number of emails that were successfully delivered, opened, and clicked by your recipients.
- Sent Text Messages—generates a time period-specific report on the number of text messages that were successfully and unsuccessfully delivered as well as the number of text messages that resulted in opt-outs or clicks.
- Sent Push Notifications—generates a time period-specific report on the number of emails you've sent as well as the number of emails that were successfully delivered, opened, and clicked by your recipients.
- Web Activity—generates a report on the visitor traffic and lead conversions of your website.
- Tracking Links—generates a report on the metrics of the links hosted by your website.
- Popups—generates a report on the number of contacts and clicks you acquired through your website pop-ups.
- Who is Visiting—generates a report on the number of prospective clients that visited your website.
- Click Fraud—generates a report on the number of click frauds your links received.