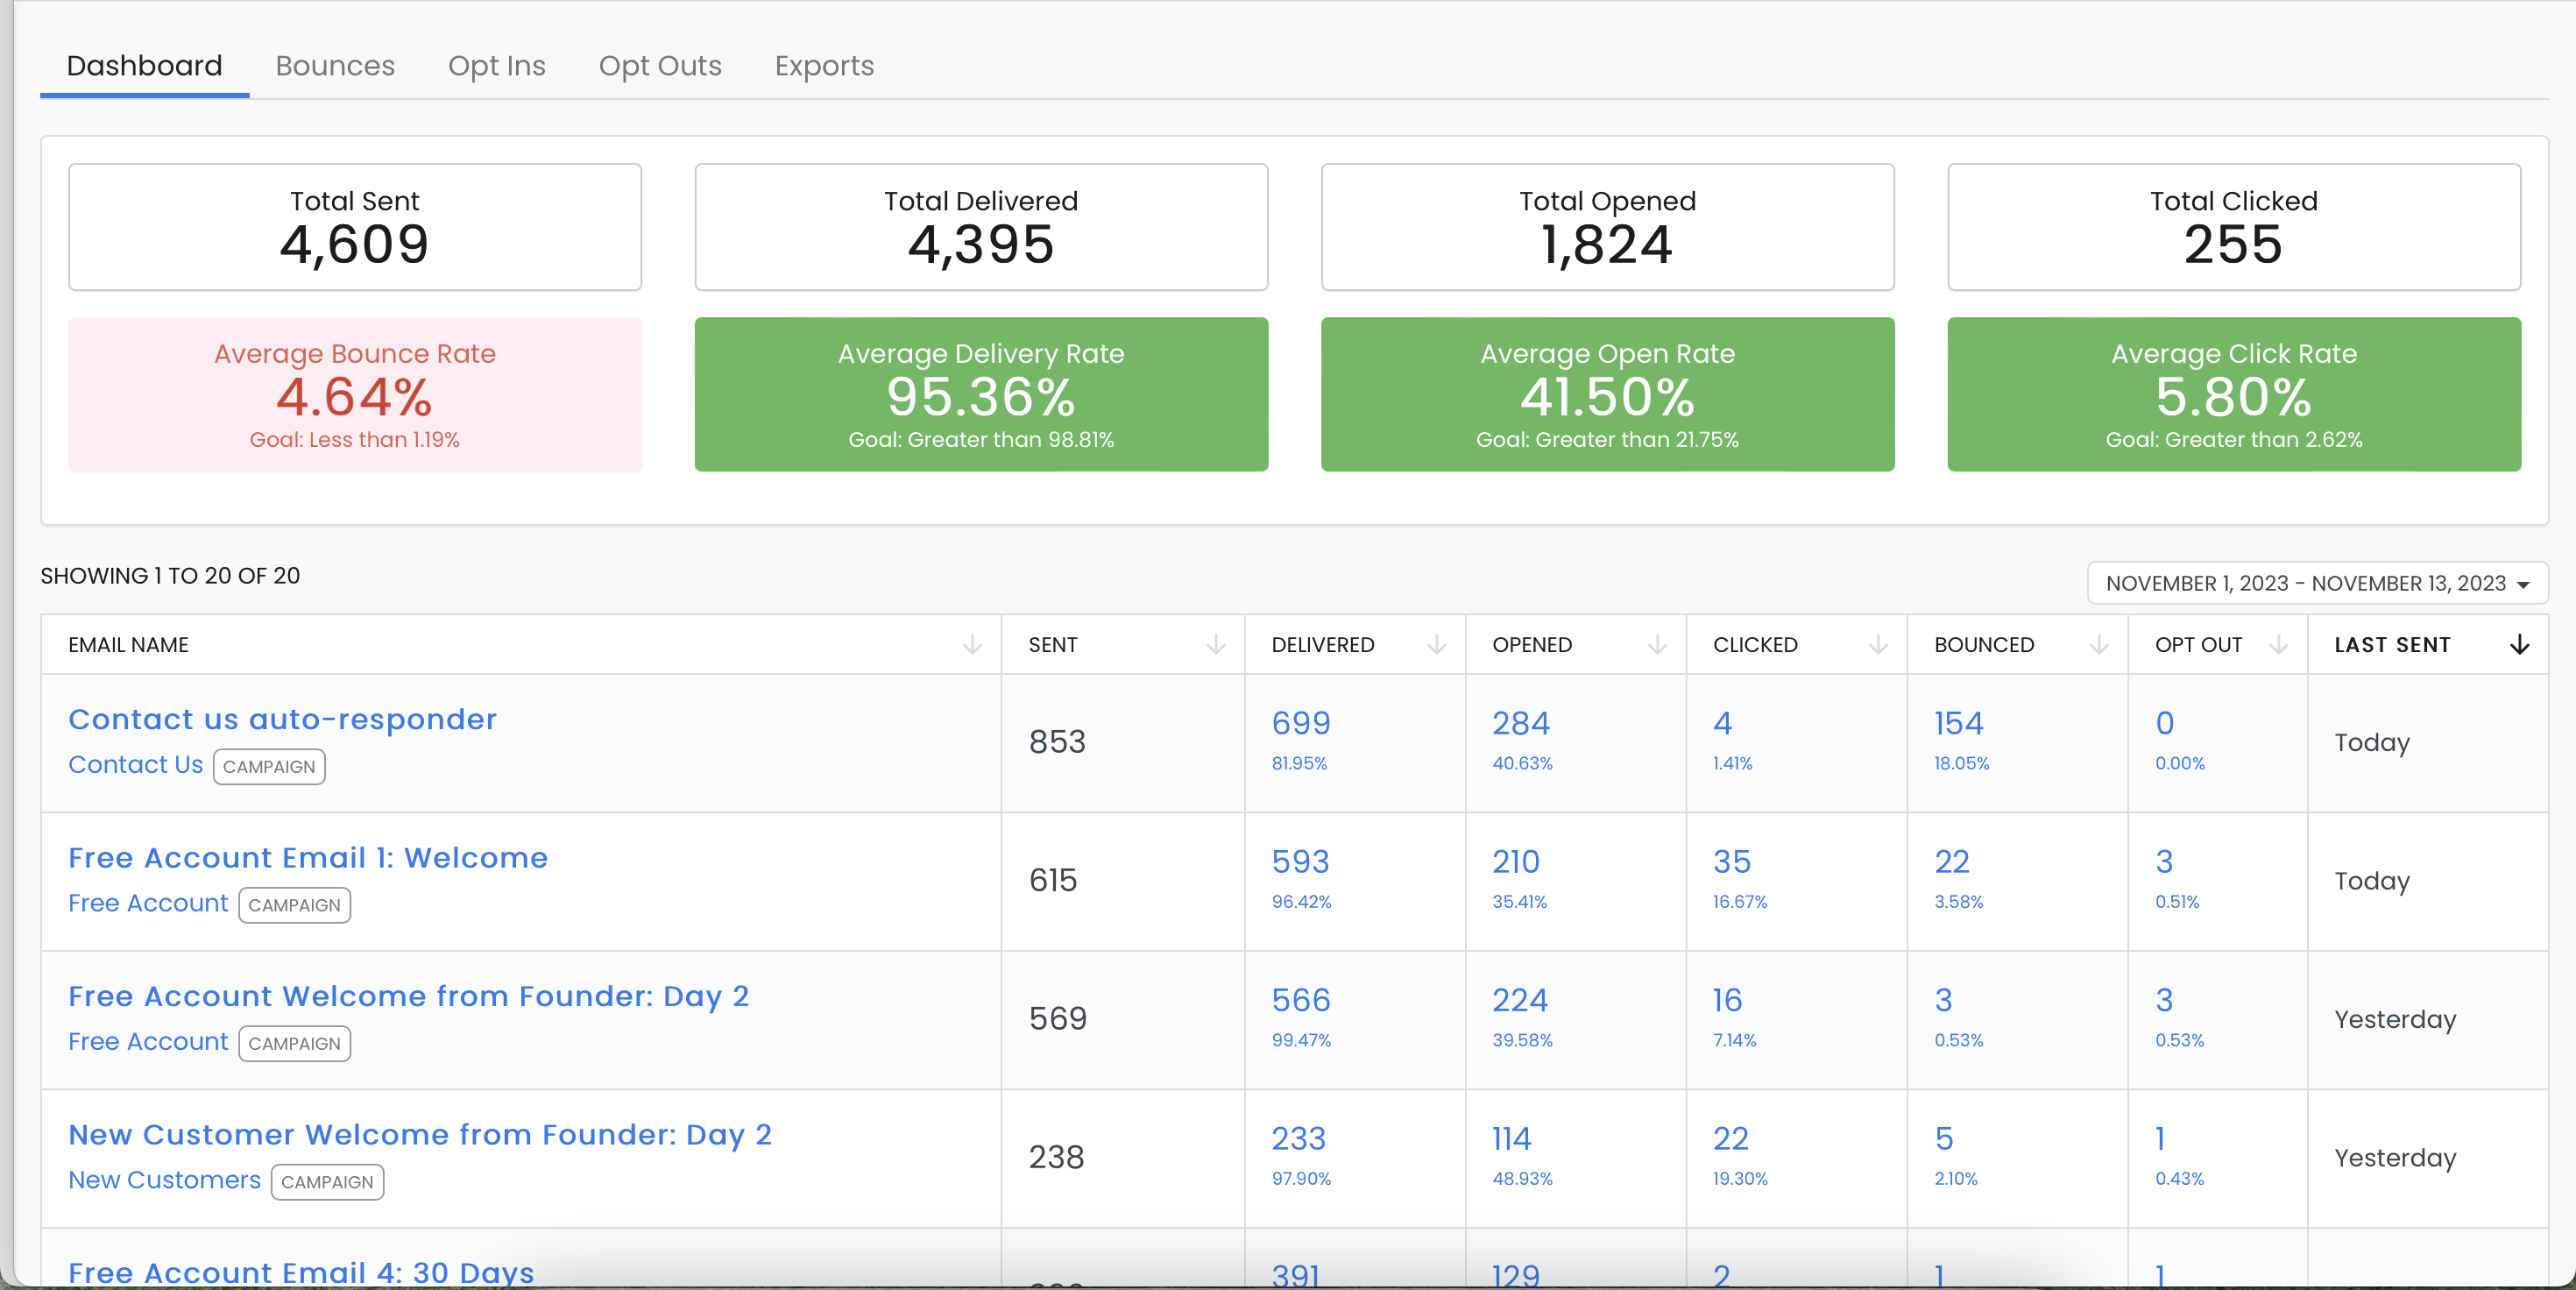
From the email reports homepage, you will find a summary dashboard for total sent, total delivered, total opened and total clicked across all emails within a selected time frame.
RecommendedAutomated emails previously showed an aggregate total in reports, but now, you'll see data tied to specific timeframes.
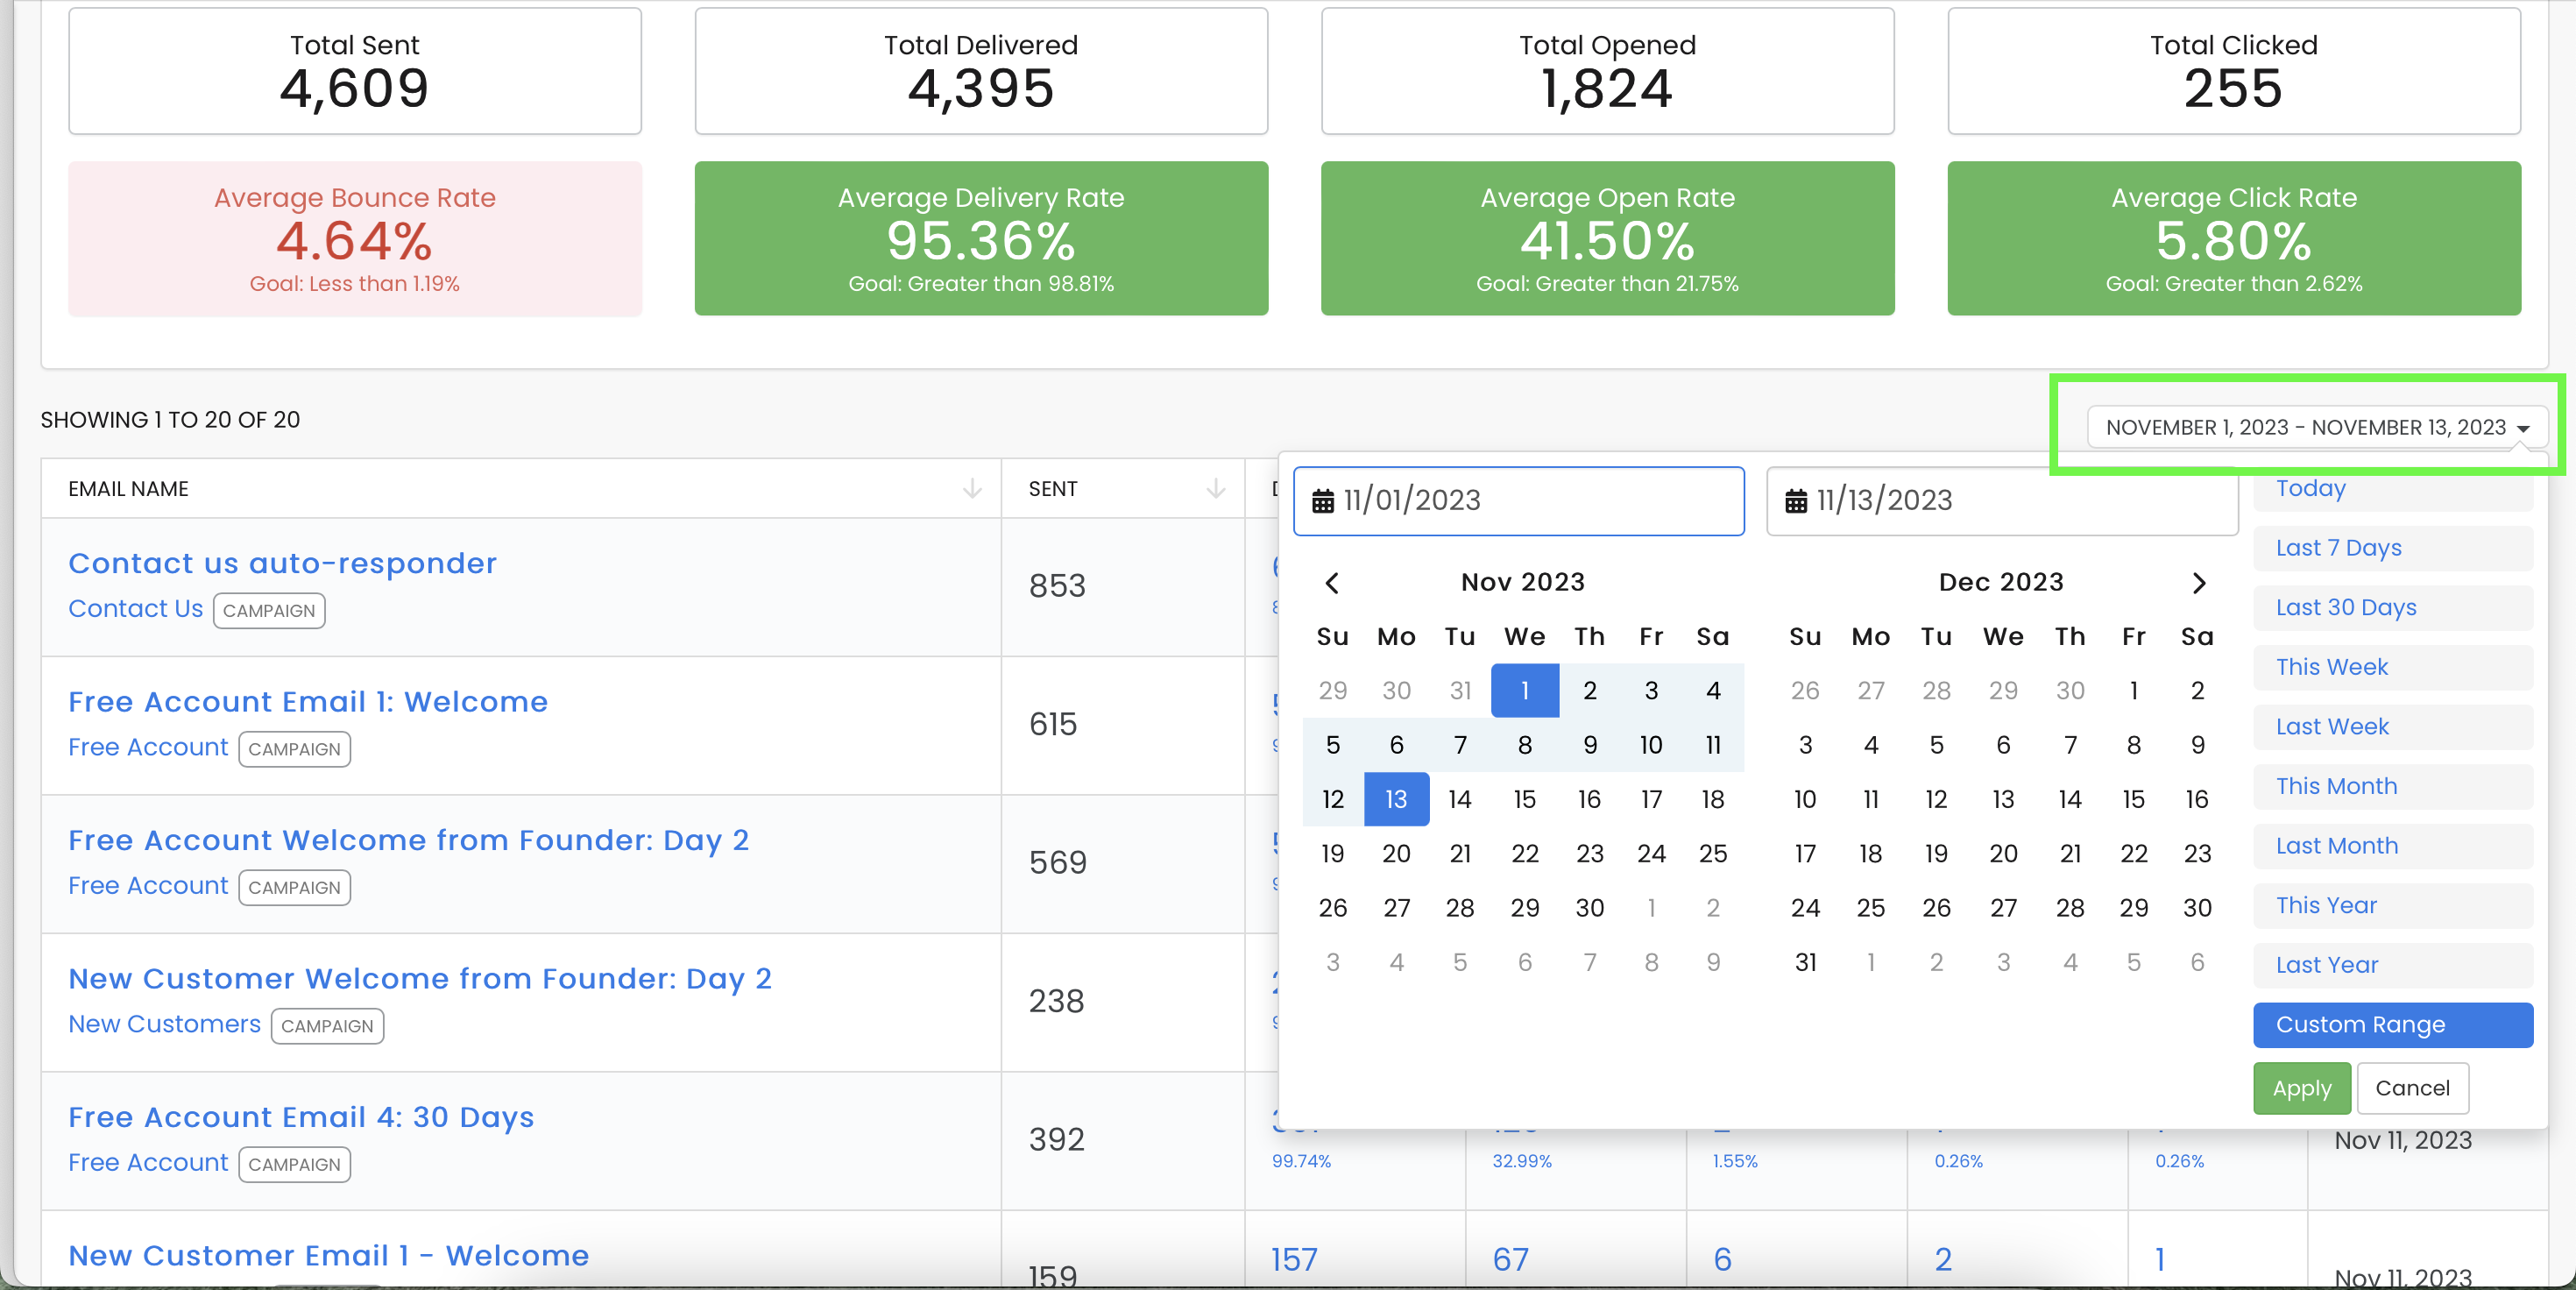
To choose a time frame, click the calendar drop down menu and select a set time frame or a custom range and click Apply.
Beneath the dashboard, you will see a list of emails for the time frame selected and the following summary information for each:
To see more detail, click on any of the fields that are in blue (name, opened, clicked or bounced) and you will be taken to the supporting data for that specific email message.
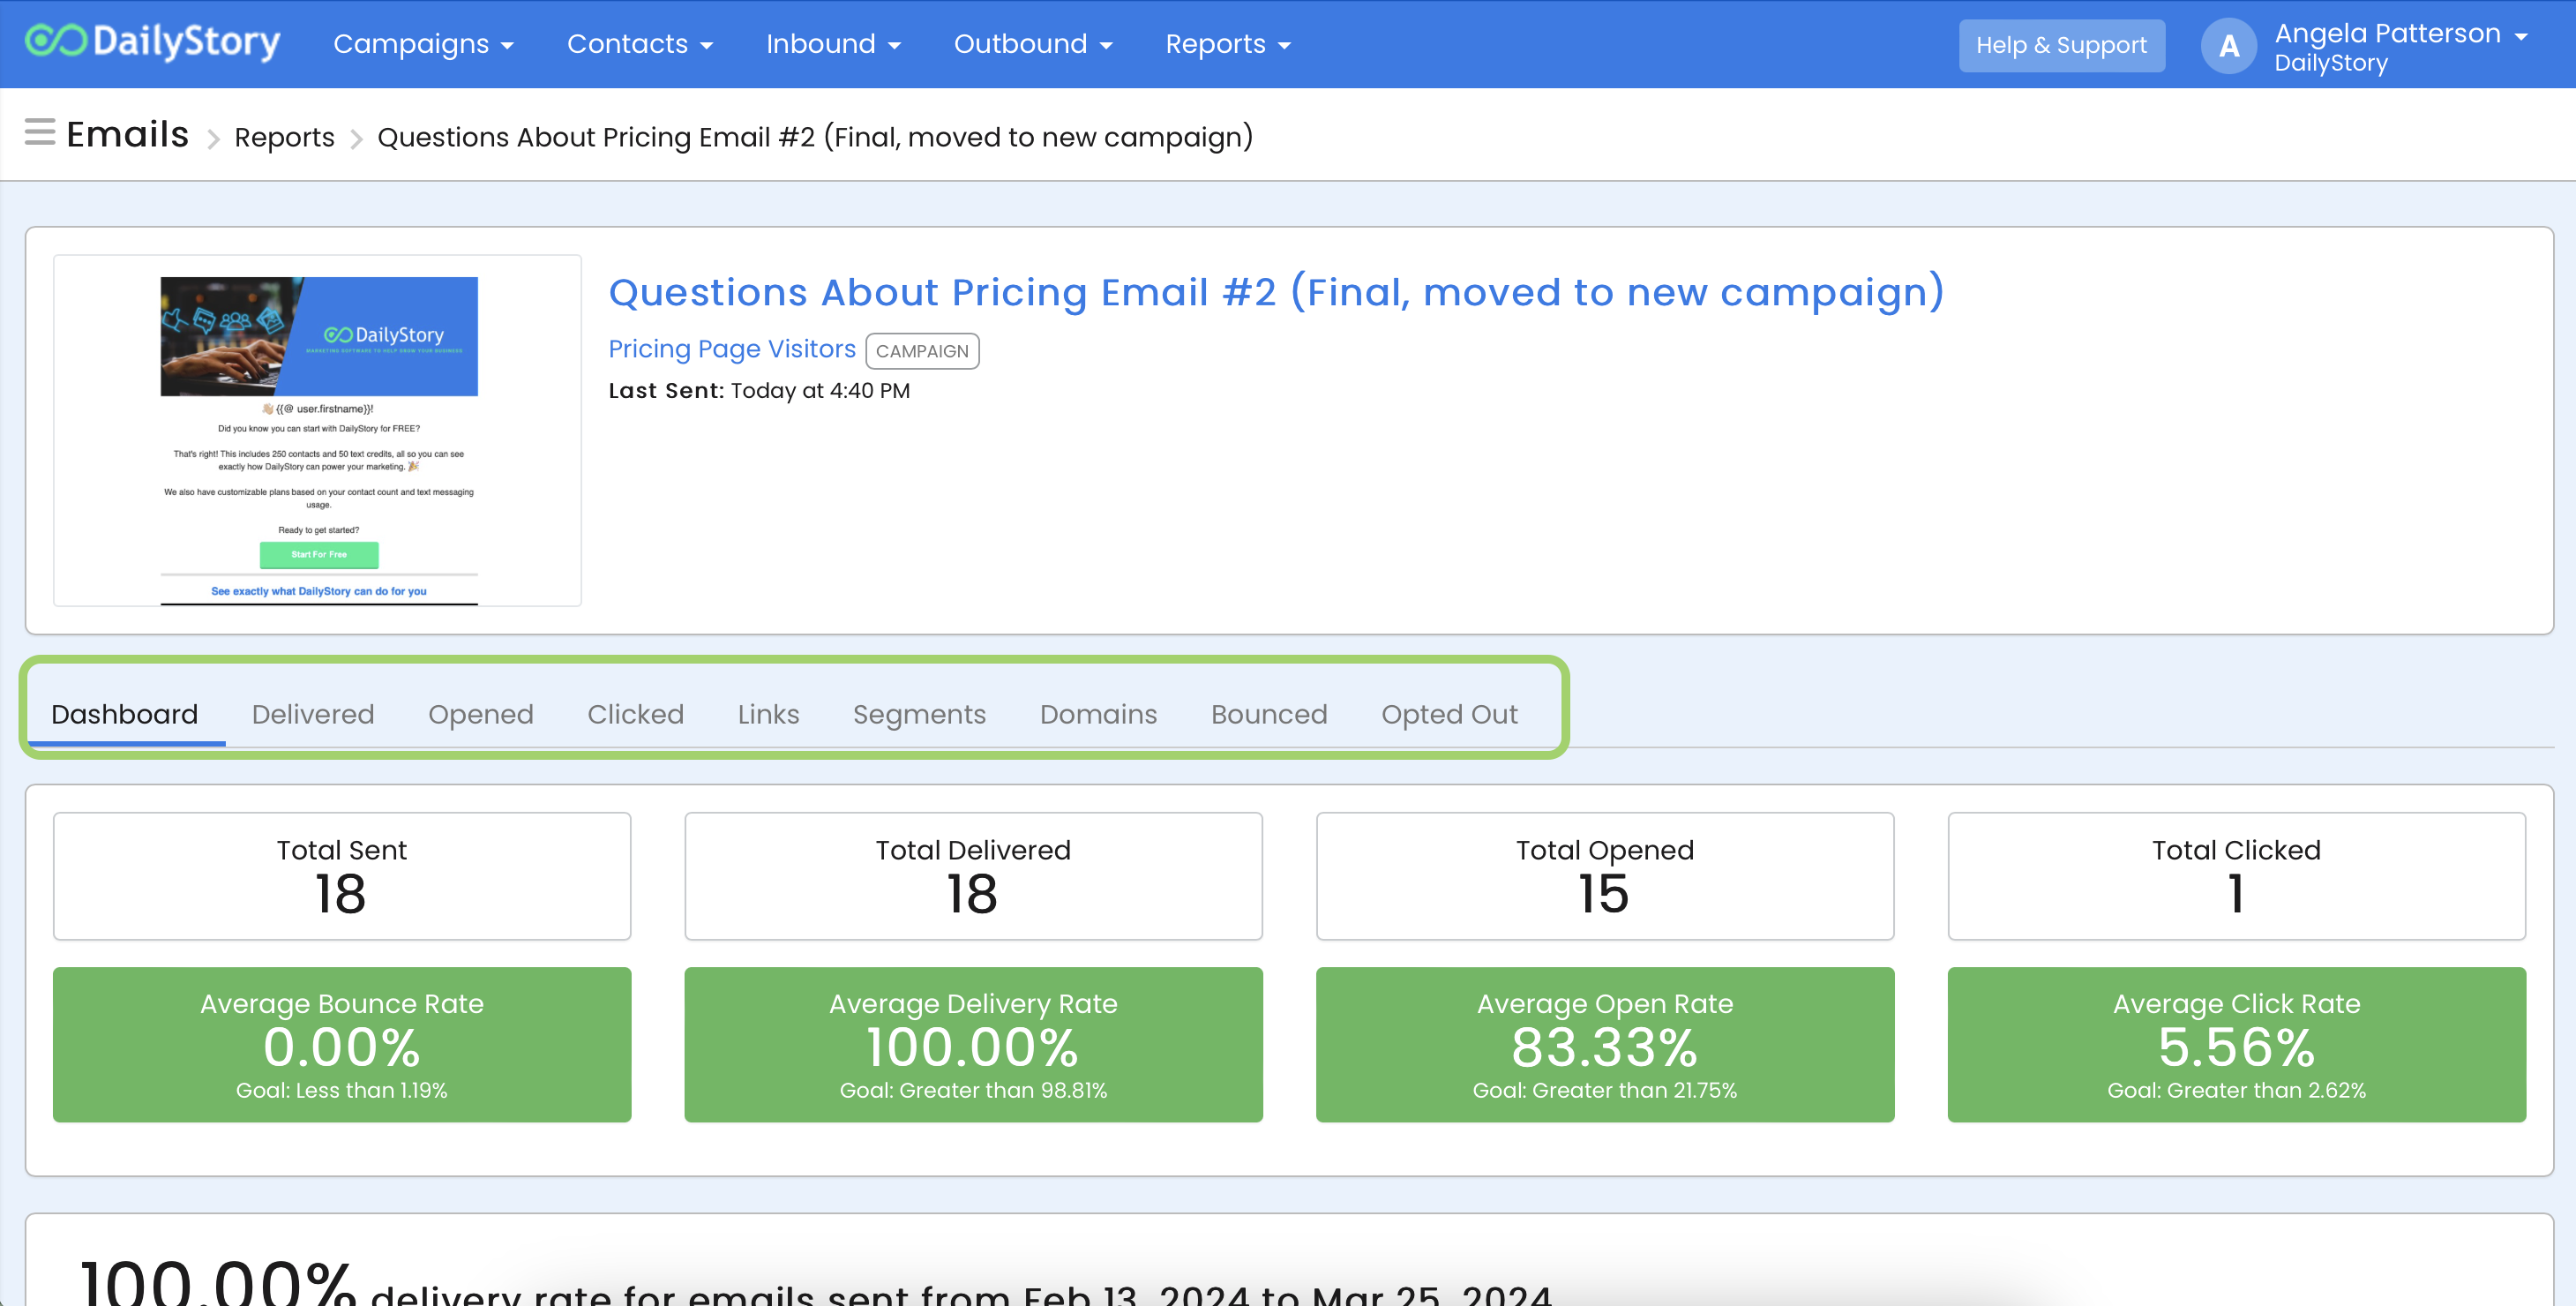
Once you are inside the report for an individual email, a new dashboard will appear with search results that apply for that specific email. You can select an option from the toolbar for more specific information:
In addition to the standard reports, at the bottom of the email report you'll find a link to the Heatmap of links clicked in email. This report provides visualization of where clicks occurred in your email:
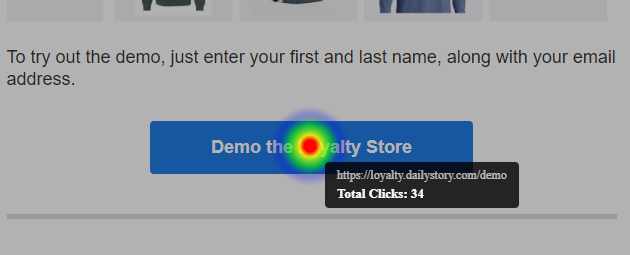
The heatmap report is also exportable as an image.
Once you click on a metric link for supporting data, you have several options:
Export button (located at the bottom of the page). More on exporting.Create Segment button (located at the bottom of the page)Previous and Next links